
Decision Question
Could a conventional anoxic zone design release more capacity in Battery C, or did its catchment and wastewater composition require a different solution?

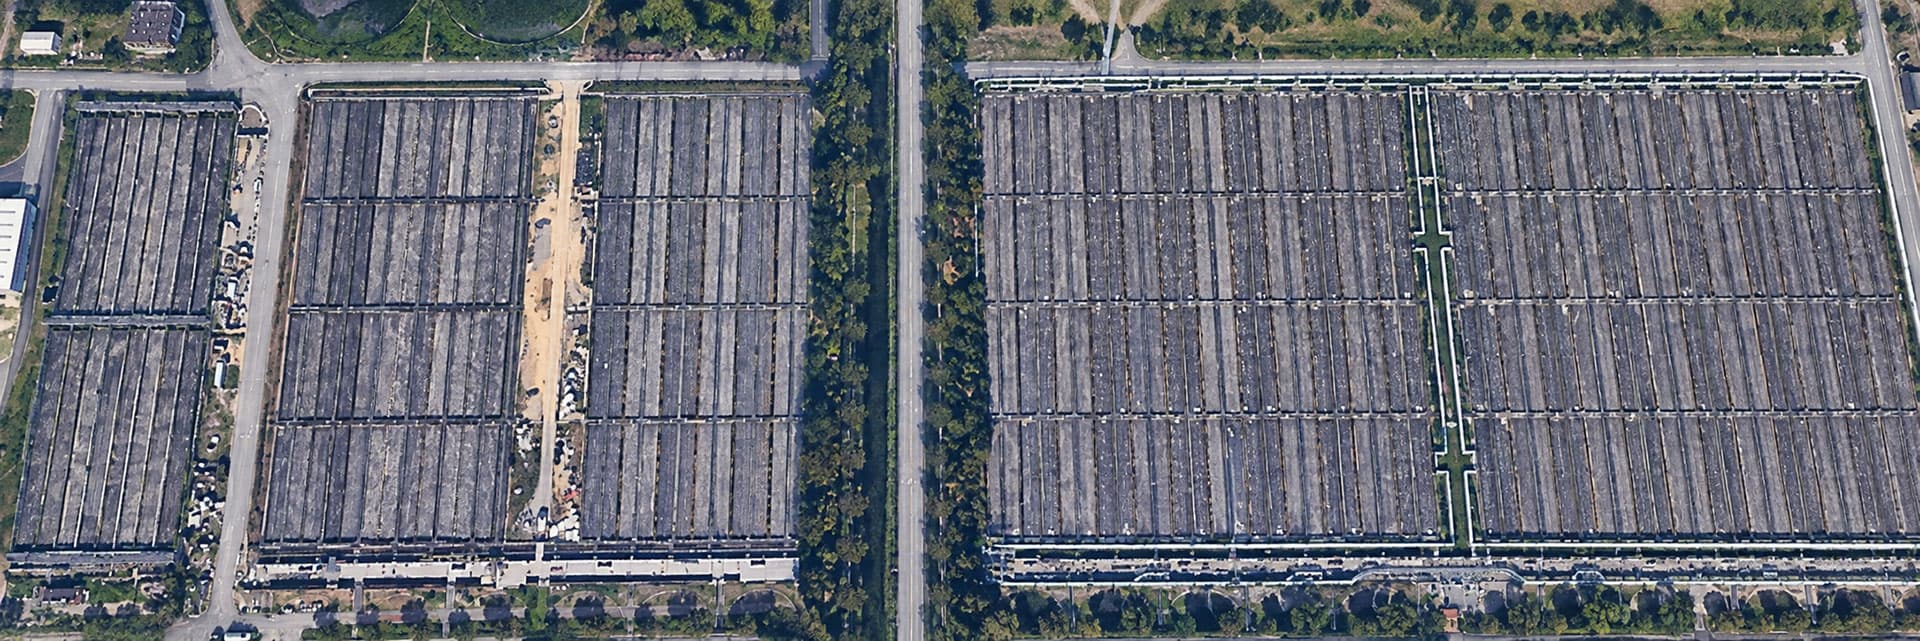
Temporary Optimisers compared settled-sewage composition across two process batteries before moving to an existing anoxic zone. Minute-level trends showed that Battery C received less soluble carbon relative to ammonium and behaved differently from the reference battery, prompting the project team to reconsider a conventional anoxic zone design and take a wider systems approach.
Could a conventional anoxic zone design release more capacity in Battery C, or did its catchment and wastewater composition require a different solution?
Large activated-sludge works.
Five process batteries, approx. 2.1 million PE
AMP7 growth scheme
Nitrate management
Existing Lane 18 anoxic zone assessed against a reference battery
Two temporary Optimisers relocated across two one-week phases
The same Optimisers moved from catchment comparison to direct process assessment.
Reference load profile
Target load profile
Release more hydraulic capacity in Battery C while managing nitrate under a growth scheme
Existing data did not explain inconsistent denitrification or show whether Battery C matched the reference battery
A conventional anoxic zone solution risked carrying the wrong design basis into investment decisions
Minute-level evidence linked anoxic performance to catchment loading and available soluble carbon
Two temporary Optimisers across Batteries B and C, then Lane 18 anoxic inlet and outlet
Dissolved COD and ammonium at one-minute resolution
Client flow data, process location and live dashboard trends
Rapid deployment, relocation, data checks, dashboards and engineering interpretation
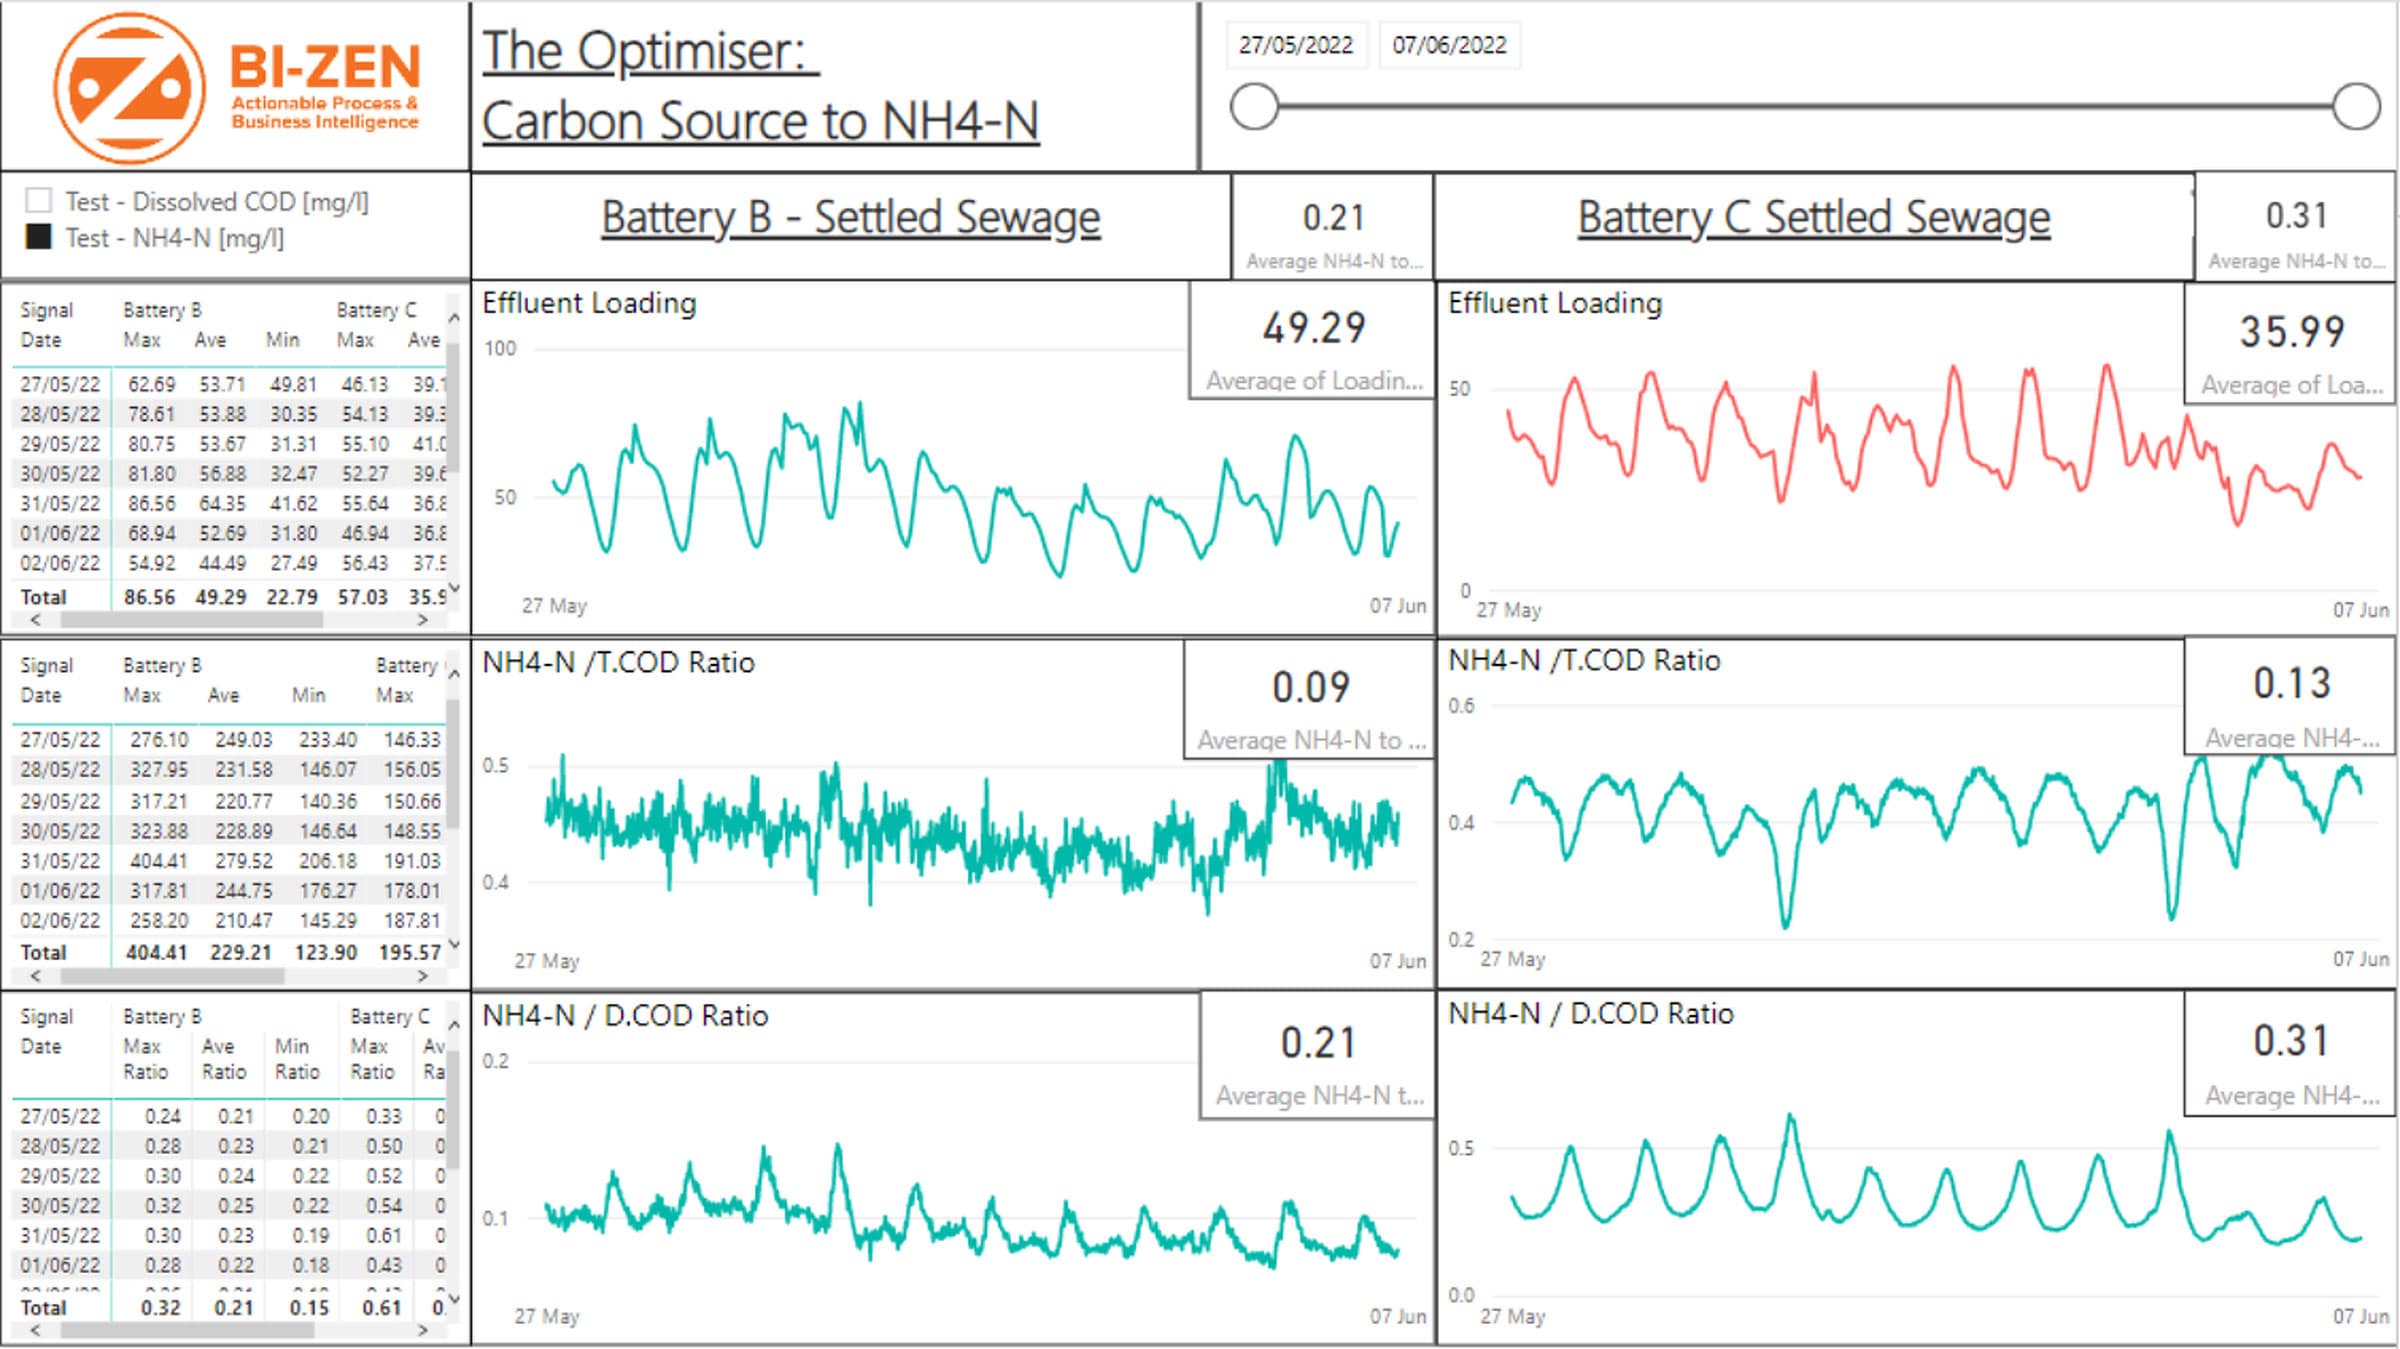
Battery C did not behave like the reference battery. Minute-level trends showed a different diurnal load profile and less soluble carbon relative to ammonium. Lane 18 monitoring also confirmed that denitrification was not consistently established. The evidence linked the weak performance to influent conditions and process configuration, rather than anoxic volume alone.
The project team could not assume that a conventional anoxic zone design would work across Battery C. The evidence prompted a wider systems review before selecting the growth solution and reduced the risk of investing in capacity that would not address the underlying limitation.